Visual Argument
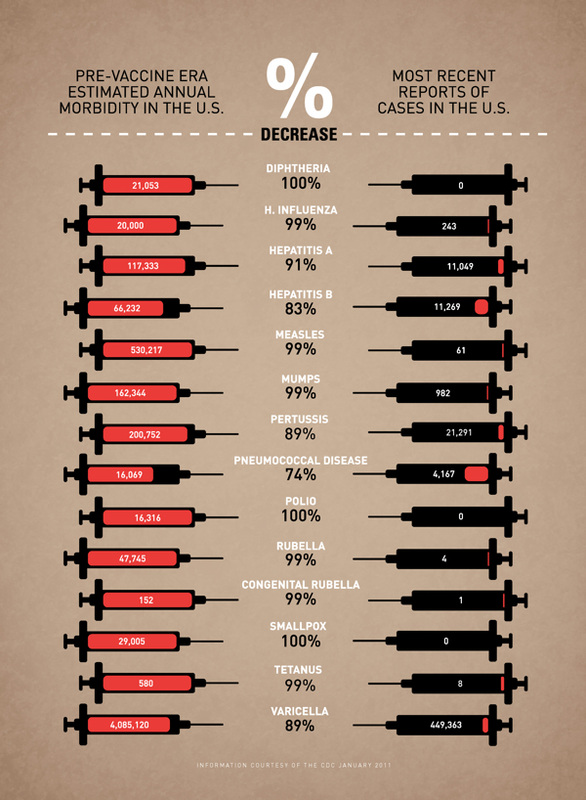
Vaccine Infographic by Leon Farrant, graphic designer.
This infographic by Leon Farrant
supports the argument that vaccines are still a very effective way to prevent
many deadly diseases in the United States. This infographic addresses the debated issue of vaccine efficacy by visually comparing the morbidity rates of the pre-vaccine era with the current morbidity rates for the same
diseases in the United States. The infographic uses data published by the Centers for Disease
Control and Prevention in 2011.
Farrant's piece can be considered an argument because it decidedly supports the pro-vaccine opinion. The piece does not contain a single component that repudiates the efficacy and benefit of vaccines. The piece visually reveals that morbidity rates have drastically fallen since the advent and administration of vaccines in the United States. The piece also points out the percent decreases in deaths due to the vaccine-preventable diseases.
Farrant heavily appeals to logos in his piece, relying on the viewer to value and consider the statistics that support vaccine efficacy. Farrant uses morbidity rates and data that was published by the Centers for Disease Control and Prevention (CDC), which may hinder the effectiveness of the argument if the viewer distrusts government agencies such as the CDC. However, the visual component of Farrant's infographic is highly valuable to promoting the efficacy of vaccines.
Farrant's use of color, familiar symbols, and delineation of statistics forms a clear message about vaccine efficacy for the viewer. Farrant could have used red and green instead of red and black in his piece, but the use of red and black is more effective because the overwhelming amount of black signifies a lack of disease in our society today. The point of Farrant's inforgraphic is to show how much the health of our country has improved since vaccines were widely put into place. The comparison of today's lack of death due to these diseases with the extent of death due to these diseases before vaccines is made more perceptible by distinctly coloring the deaths in red and leaving the empty space as black. Likewise, Farrant drives the point home that this decrease of morbidity in the vaccine era is due to vaccines by using the symbol of the syringe, rather than a pie chart or line graph. Also, Farrant exhaustively addresses the morbidity rates for each disease that children are supposed to be vaccinated against in the vaccine era. By delineating the morbidity, reports of cases, and percent decrease for each of the 14 diseases, the viewer is left with the perception that vaccines are helping to protect us against all of these diseases. Each of these disease has been effectively prevented by the administration of vaccines. If Farrant had excluded the percent decrease in each disease from his infographic, the message would not have been as strong. It is very difficult to ignore or argue with a 99% or 100% percent decrease in deaths from disease, and this use of the data further supports Farrant's argument. All of these diseases are severe and deadly, but the diseases on the infograph that have the 99-100% decreases in morbidity were very common diseases in the pre-vaccine era. The syringes on the right side of the graph, representing the vaccine era, still contain some red, but the use of the raw numbers of cases of these diseases drive home the point that vaccines still prevent thousands of deaths each year, when compared with the morbidity rates of the pre-vaccine era.
Overall the infograph is highly effective in promoting a pro-vaccine message. Farrant's infograph provides an argument supporting the efficacy of vaccines using real data in a way that is accessible to everyone through the use of visuals, colors, and statistics.
